A water footprint measures the amount of water used during the entire life cycle of a product, from production and manufacturing to consumption and disposal. More than 40% of the world’s population is expected to live in severe water-scarcity regions by 2050. Therefore, the concept of water footprint was introduced to understand the amount of water consumption in each country and induce sustainable use of water.
A single cup of coffee contains 132L of water
Water is essential for our daily routine, and we rely on it to stay clean, hydrated, and healthy. But have you ever stopped to consider just how much water you use throughout your day? From the moment you wake up and turn on the faucet to brush your teeth, to the final flush before going to bed, water is a constant presence in our lives.
However, you may be surprised to learn that the amount of water you use directly is just the tip of the iceberg. In fact, a significant portion of the water we consume is embedded in the products we use every day, such as the food we eat, the clothes we wear, and even our mobile phones. From production to disposal, the water footprint of these items can be enormous, and it’s important to understand this hidden impact on our water resources.
Coffee is a perfect example of how our water footprint extends far beyond what we see on the surface. How much water is used to make one cup of coffee? The answer is staggering: a single cup of coffee requires 132 liters of water to produce, in the process from growing and processing coffee beans to packaging and transportation.
The above figure shows the water footprint of main agricultural products as reported by the UNESCO-IHE Delft Institute for Water Education.
By understanding the hidden water cost of these products, you can probably imagine the total amount of water you may use up throughout your whole life.
―
Q. What is a Water Footprint?
―
A. A water footprint is a measure of the amount of water people use in the entire process of production, consumption, and disposal of goods and services.
And it takes into consideration both direct and indirect water use. Direct water footprint measures the amount of water used directly by the individuals, such as for washing and drinking. Indirect water footprint is the amount of water used to produce or manufacture the items we use.
For instance, let’s look at the life cycle of the shirt you are wearing. First, the producer acquires the fabric and manufactures it into a shirt, which is then sent to the store. After that, you purchase the shirt, wear it, and eventually it will be disposed of.
Of course, water is used in every step, and a water footprint would show the amount of water used in the whole process. And in this case, it would be considered an indirect water footprint. A higher water footprint means more water was used in the process, and a smaller water footprint means less water was used.
So why do we calculate water footprint?
Because it can help us understand how much water we use and use water more effectively. For starters, a water footprint allows you to measure the amount of water used to provide the goods and services consumed by an individual, community, country, or the entire human race.
It can be used to assess the efficiency of water use in the production and consumption stages of a product, as well as to identify imbalances in water use between developed and underdeveloped countries.
(55) Arjen Hoekstra on The Water Footprint of Modern Consumer Society - YouTube
● Types of Water Footprint
An environmental organization called the Water Footprint network (WFN) categorizes water footprints into three types.
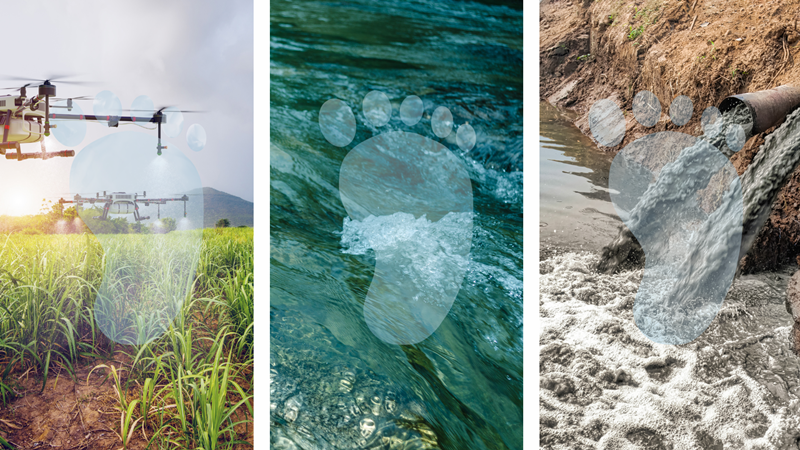
Green water footprint is water from precipitation that is stored in the root zone of the soil and evaporated, transpired or incorporated by plants. It is particularly relevant for agricultural, horticultural and forestry products.
Blue water footprint is water that has been sourced from surface or groundwater resources and is either evaporated, incorporated into a product or taken from one body of water and returned to another, or returned at a different time. Irrigated agriculture, industry and domestic water use can each have a blue water footprint.
Grey water footprint is the amount of fresh water required to assimilate pollutants to meet specific water quality standards. The grey water footprint considers point-source pollution discharged to a freshwater resource directly through a pipe or indirectly through runoff or leaching from the soil, impervious surfaces, or other diffuse sources.
Blue and Grey Water Footprint for the Industry Sector
The chart below shows the blue and grey water footprint in Asian countries. The top five countries are China, Russia, India, Vietnam, and Ukraine.
―
Q. Why is Water Footprint Important?
―
A. Water is a vital resource for all living beings on Earth. Human beings consist of 70% water, and even a single day without water can lead to severe discomfort and endanger their lives.
As water scarcity has become an environmental issue around the world, the international community has begun to look for ways to address it. One of the efforts involve trying to understand how much water is actually consumed in each country and coming up with ways to prepare for future water shortages. This is where the concept of water footprint was introduced.
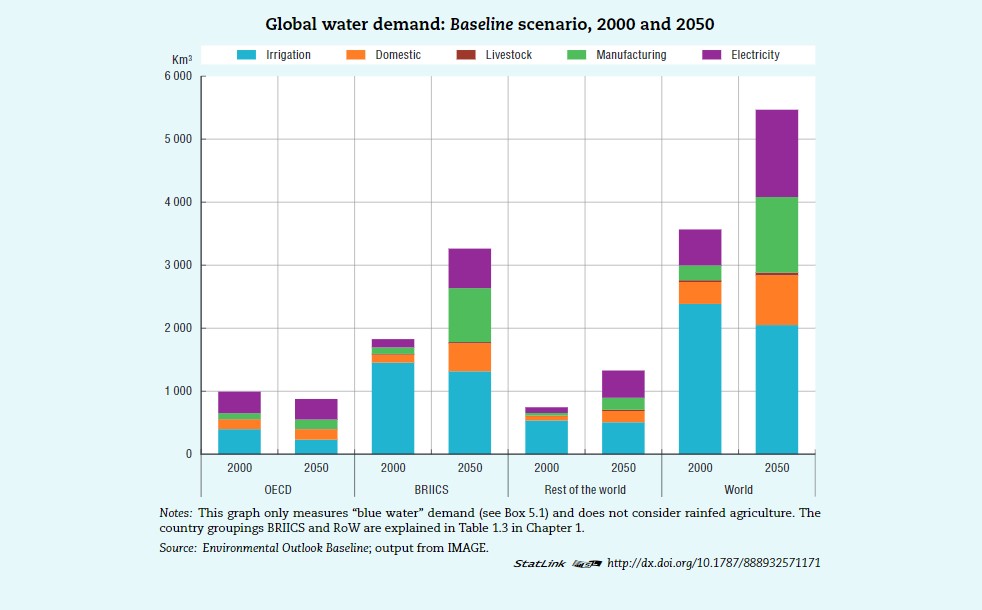
The OECD Environmental Outlook to 2050 released in 2012 predicts that the economy will develop four-fold and the population will grow to about 9 billion. If this trend continues, humanity is more than likely to need more water resources.
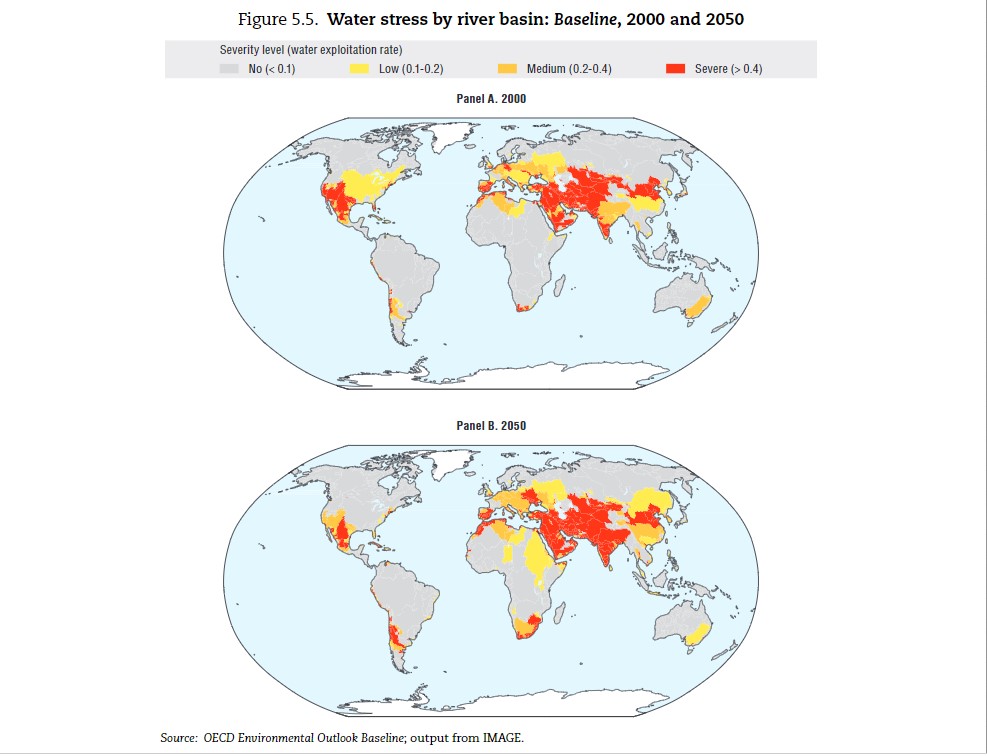
The report also predicts that more than 40% of the global population will live in severe water-stress regions. Among the 34 OECD countries, South Korea, Belgium, and Spain rank as the top three countries under severe water-stress.
―
Water Footprint of Daily Products
―
Agriculture and industry use the majority of the world’s freshwater, 70% and 19% respectively. While this is true, there is also a sharp increase in domestic water demand from households. According to a new data from World Resources Institute (WRI), domestic water demand grew 600% from 1960 to 2014, which is much faster compared to any other sector.
The chart provided below shows the water footprint of various food products to help you understand their impact on water consumption. It is evident that meat has a significantly larger water footprint compared to most other food items. If you choose to consume more vegetables, you can effectively reduce your water footprint.
You can also use the link below to learn the water footprint of other food products you enjoy.
PDFHowtoCalculatetheWaterFootprintofanyFood.pdf
―
Water Footprint Calculator
―
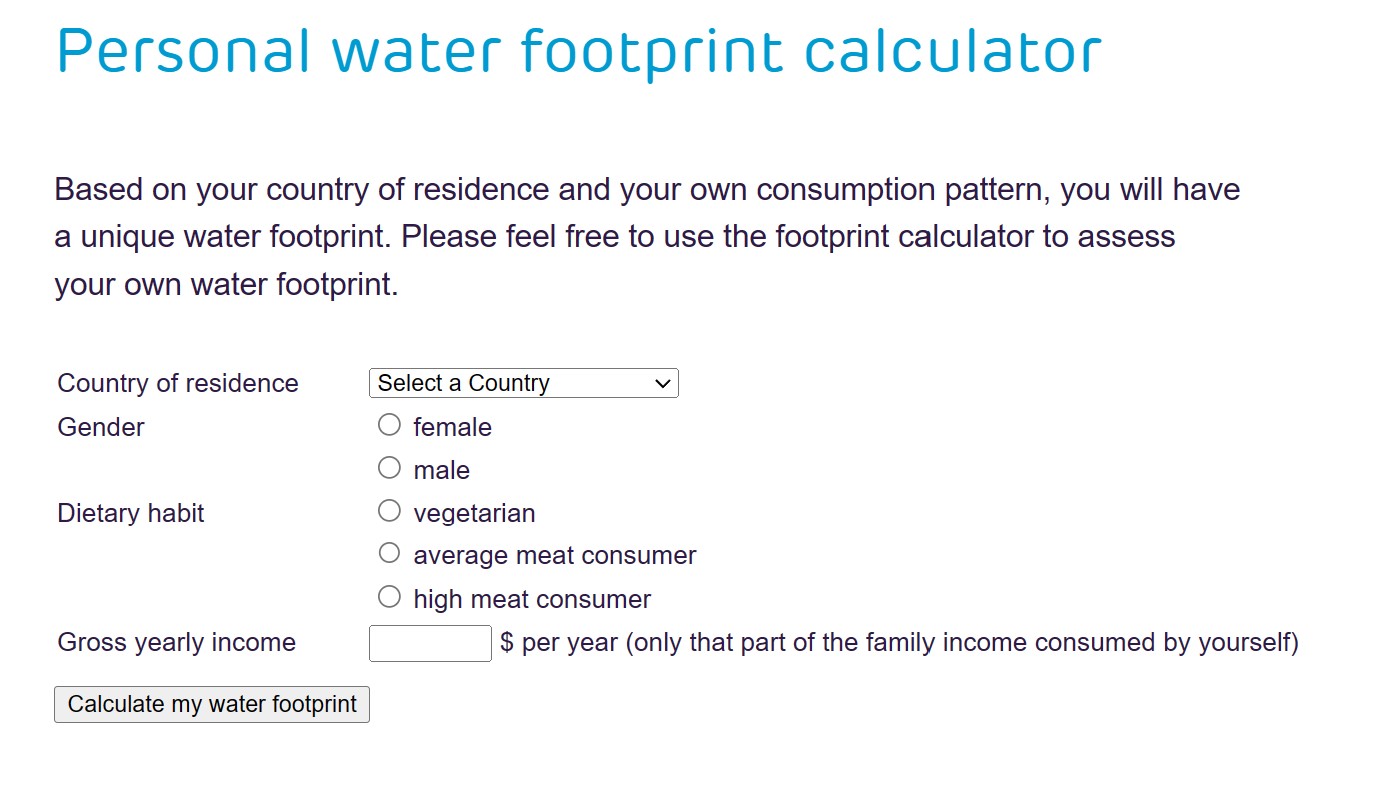
The Water Footprint network (WFN) website has an interesting calculator that assesses your own water footprint if you enter your country of residence, gender, dietary habit, and income.
It is an estimation based on the average consumption patterns of individuals in each country. Therefore, it may not be exact, but it is a useful tool that enables you to compare your water footprint to the global average.
―
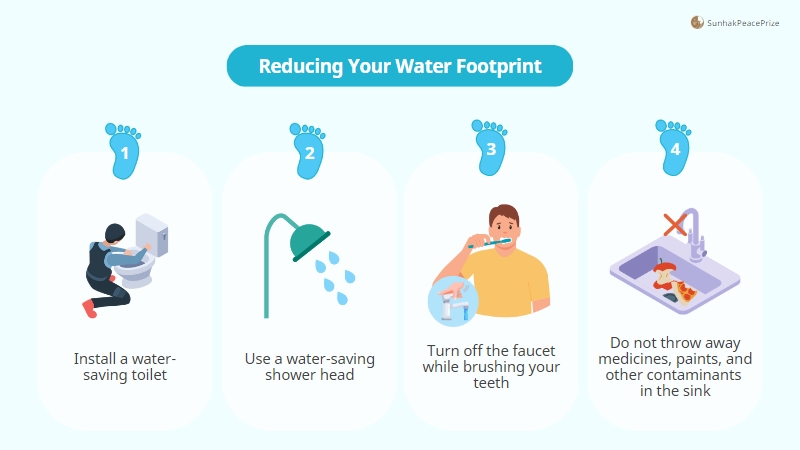
How to Reduce Water Footprint
―
What are some ways to reduce our water footprint?
The indirect water footprint is said to be much larger than direct water footprint. Let us look at two ways to reduce the amount of indirect footprint.
The first method is to replace consumer products that have a large water footprint with other types of products that leave a smaller water footprint. For example, you can save a lot of water by eating less meat and more vegetables, drinking tea or water instead of coffee, and wearing processed fibers instead of natural fibers.
It may be hard for some people to choose vegetables over meat, or to give up coffee and pure cotton. If you are one of them, there is a second option.
You can stick to the same consumption patterns but choose meat, coffee, and cotton that comes from regions with a relatively small water footprint or where water scarcity is not as high.
This seems doable, but there is one little problem. In order for you to make these choices, you need the right information. However, there is not much information out there that tells you which brand of coffee has a lesser water footprint.
It is crucial for consumers to demand transparency from companies regarding their manufacturing processes and to urge governments to establish appropriate systems or institutions.
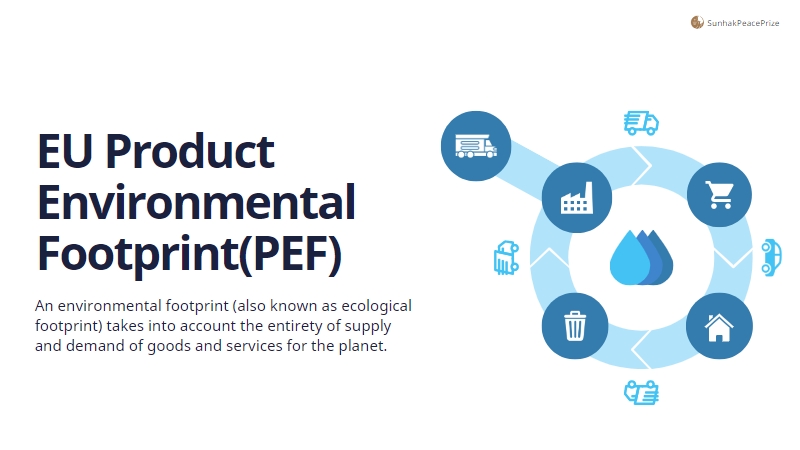
In 2020, the European Union (EU) initiated the Product Environmental Footprint (PEF) scheme, which assigns a quantifiable value to products based on the amount and quality of water consumed throughout their lifecycle, from production to disposal. This scheme can help companies better understand their water consumption and reduce their product costs, while enabling consumers to identify environmentally-friendly products if adopted worldwide.
It is important to be mindful of our water footprint as the production, disposal, and use of products consume more water than we realize. By understanding the hidden water costs of products like coffee, we can take steps to reduce our water footprint and make more sustainable choices.
Protecting the environment means protecting our own future. And small steps like conserving water while washing dishes or taking shorter showers can make a significant impact. Let’s all take part in protecting the Earth for a better future.
“Human beings and nature have an inseparable relationship.”
-Dr. Hak Ja Han, Founder of the Sunhak Peace Prize-
Learn more about this issue: |
Written by Sharon Choi
Director of Planning
Sunhak Peace Prize Secretariat